In all honesty, I had the very same issue with segmentation. Sure, I made it to Calculus II in college, but I earned a C+ for all my effort. However, I did learn just enough to understand what makes segmentation so difficult to visualize. Basically, segmentation requires thinking in multiple dimensions--easy for computers, hard for me. Hence the C+.
Until recently, that is. I figured out that I actually can visualize multiple dimensions very easily. As a matter of fact, I’ve done it for years. And so have you.
In fact, let me share a mutli-dimensional matrix right now:
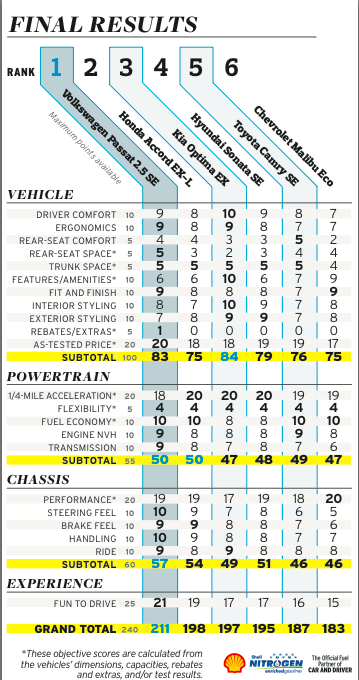
In the above chart, the writers and editors of Car & Driver magazine have helpfully created a 22-dimensional matrix as part of a car comparison article. That is, they created a consistent set of 22 measurements to rank six cars. Each measurement has a consistent scale of five to 25 points. The different point values, by the way, correspond to a sort of weighting. As might be expected from a car enthusiast magazine, the “fun to drive” dimension receives a high weighting--25 points. They give “rear-seat comfort” one-fifth the weighting, or five points.
In the simplest form of segmentation, an overall segmentation, we need look no further than the bottom line, or grand total. We see that the top third includes the VW Passat (grand total 211) and the Honda Accord (198), the middle third includes the Kia and Hyundai and the bottom third includes the Toyota Camry and Chevy Mailbu. We could, by the way, label each car a “sexile,” since there are six of them, but that term has a more prominent meaning.
Overall value segmentation for customers works exactly the same way. The model includes all the components that make up customer value (average order size, order frequency, customer tenure, etc) and ranks them from first to last.
See? Not so hard. Now, we can also apply this simple logic to more sophisticated types of segmentation.
Some segmentation models may take into account only part of the data. A retailer offering a new line of kitchenware might focus efforts just on the best kitchenware customers. Using the Car & Driver model, we might only want to rank the cars based on what the magazine calls “vehicle” characteristics (styling, comfort, etc). In that case, the top third would include the VW and the Kia rather than the Honda.
Of course, the challenge with these more advanced forms of segmentation lies not in their calculation, but rather their inspiration. In the case of the kitchenware segmentation above, targeting past purchases seems like a no-brainer. But what would the retailer have done if it had never offered kitchenware before?
Here’s where testing comes in. When a marketer speaks of testing segmentation, what he really means is that he’s testing his guesses. So in the retail example, the marketer might substitute something that lives in the same general area as kitchenware, such as linens.
Of course, segmentation gets a lot more sophisticated quickly. I’d explain it to you, but gimme a break; I’m only a C+ Calculus II student.
No comments:
Post a Comment