So far in our discussion of how sports and media have created data streams that changed fans’ perspective, we’ve discussed The Daily Racing Form--which drew from telegraph and newspapers--and baseball--which drew from radio. You don’t need to be Marshall McLuhan to know what comes next.
Obviously, television has dominated the American communication landscape from the postwar era on through today. However, three distinct forms of TV--broadcast, cable and HDTV--each promulgated data that helped drive three different sports to degrees of prominence in football, basketball and hockey, respectively.
How each version of TV drove change helps us understand how different types of data help us see things--literally see things, in this case--differently.
Football and Broadcast TV
Football had deep roots in America long before NBC televised a game at Ebbet’s field in 1939. The NFL had formed in the previous decade and colleges had played earlier versions of the pigskin game since the 1880s. In fact, major colleges banded together to form the NCAA at the behest of President Theodore Roosevelt in 1906.
However, football had not enjoyed anywhere near the popularity of baseball. Baseball team owners fought state legislatures to allow games on Sundays while colleges settled for Saturdays. And football played second fiddle until TV came along.
At the dawn of the TV age, wrestling and roller derby arose as early favorites. As the medium developed, clearer pictures and the addition of color brought a new dimension to football. Enhanced pictures allowed Americans to see the game as they never had before. No newspaper article, no radio announcer, could convey the sheer violence of football players colliding, the fluid grace of an agile running back or the balletic leap of a flanker.
In fact, no seat in the stadium could offer fans what the TV did. Even the best seats in the house really only allowed their occupants to see the action close up when the line of scrimmage ran within 10 or 20 yards of them. Meanwhile, the fan at home with his Philco could see everything.
In terms of data, the fan now had what we might call granularity. Rather than seeing the game as a swarm of 22 men, they could see it as individual and discrete actions and movements. Football became more personal, right down to the beads of sweat on the quarterback’s brow.
Basketball and Cable TV
Most fans attribute the ascendancy of the National Basketball Association in the 1980s to the signal rivalry of Larry Bird and Magic Johnson, the twilight years of Dr. J and the rise of a man who earned the title of most popular athlete in the world. While these men certainly helped elevate the league, I find it no coincidence at all that the 1980s also saw the rise of cable TV and perhaps more specifically ESPN.
Zeroing in even further, sports news programs like SportsCenter helped boil down basketball to its most dramatic elements, exciting plays such as dunks, blocks, rebounds and three-point shots. Fans watching an episode of SportsCenter could feel as if they had seen everything worth seeing in basketball that day, not just what their local team did.
In data terms, cable TV--and its news shows--represented a rudimentary form of analytics. While real analytics relies on statistical modeling to identify significant data, SportsCenter uses a small army of producers and editors to find, package and broadcast the significant bits of footage. The net result remains the same from the fans perspective. Rather than browse through hours of data, they can consume the most important data in minutes.
Hockey and HDTV
Do you remember the 1994-95 National Hockey League lockout? What about the 2004-05 lockout, then? If you’re an American, you probably don’t. For that matter, the NHL still trails the three other major sports in most categories.
However, the NHL did enjoy a blip in popularity after the latter lockout. Some pundits attributed the gain to HDTV. The wider screen allowed fans to see more of the action at once and the higher resolution finally allowed Americans to see the damn puck.
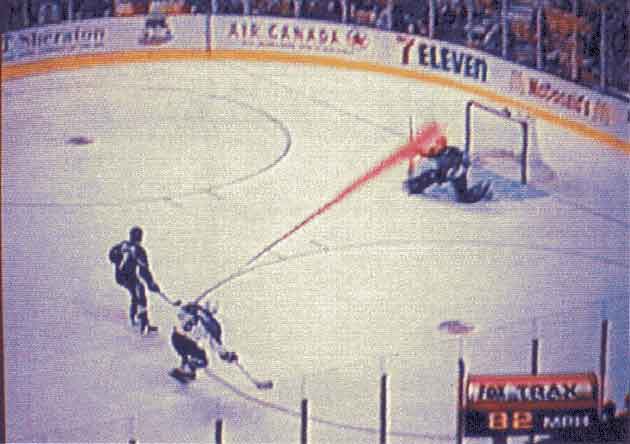
Before HDTV, Fox made the puck glow, which made Canadians ask how hard could it be to spot a black puck on white ice?
Again, HDTV did not make the NHL leapfrog the other leagues in ratings, game attendance or merchandise sales. However, having worked with a cable provider throughout the latter half of the first decade of this century, I can tell you that programmers attributed the modest ratings growth to HD as a matter of received wisdom.
In a way, the widening of the point-of-view and the visualization of the puck resembled the data granularity discussed above in terms of the NFL. However, the wide screen/clear puck combination added yet another data wrinkle: extrapolation. They could see more of skaters entering into or leaving out of the frame. They could see the path of the puck. And with these data, they could estimate who would reach the puck first, the defender or the wing.
In data terms, extrapolation refers to the ability to predict how data will change over time. That is, if the number of customers declined 10% in year one and 20% in year two, an analyst might predict that they will decline 30% (a 10-point gain) to 40% (a 100% gain) in year three. HDTV gave data that allowed fans to predict the future, after a fashion.
With the advent of television, sports of all types changed in ways both trivial (bigger numbers on uniforms, more time outs for commercials) and profound, such as the examples above. Certainly, no medium looms larger.
That said, we live in another great era of sports media transformation: the rise and evolution of the Internet. In the next few posts, I plan to discuss first how different sports emerged thanks to the Internet and then how sports themselves went through massive change as a result of the Internet.
As for now, the Yankees are on tonight and I need to see who’s pitching.
No comments:
Post a Comment